
Power BI Fundamentals Training
3 days (10:00 AM - 5:00 PM Eastern)
$1,295.00
Register for a live online class.
Details
Subjects Covered
Prerequisites
Setup Requirements
Details
Course Details
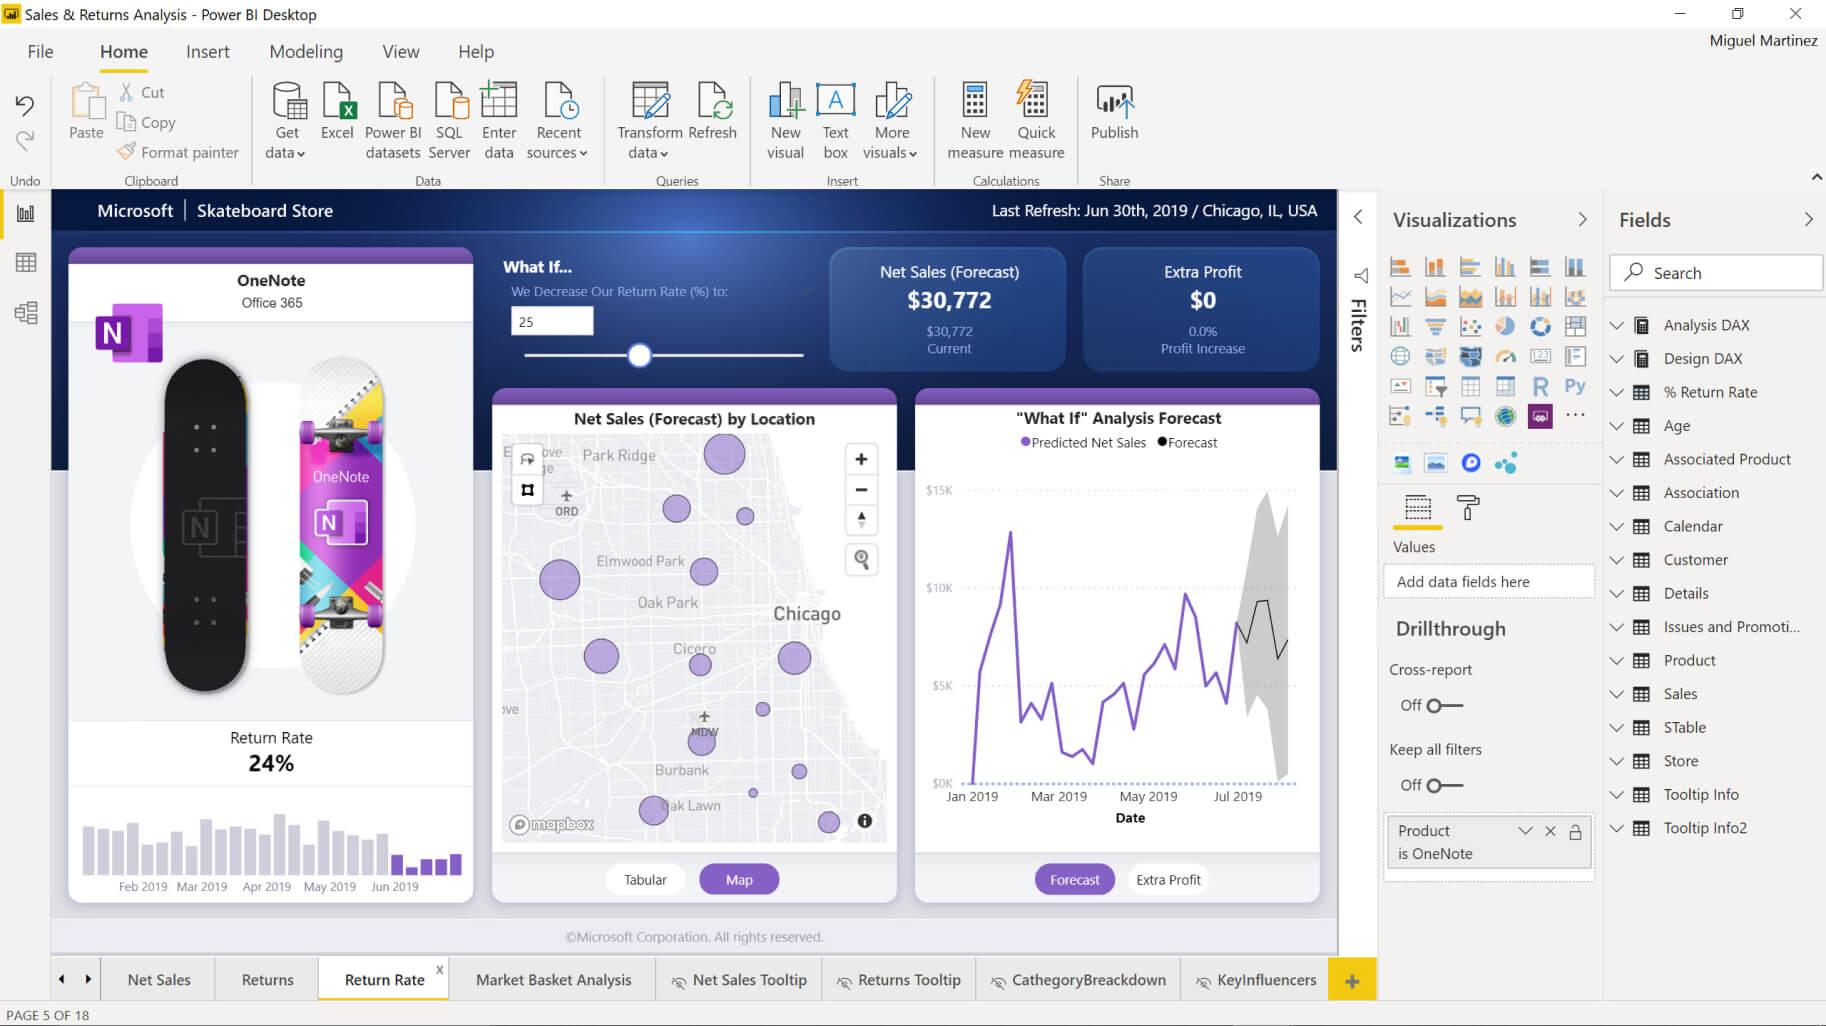
Welcome to Microsoft Power BI Fundamentals! This course will show you how to link and model data in Power BI and create visual reports that reveal data insights. By the end of this course, you will understand the following:
- The purposes and essential functions of the core Power BI components
- Using the Power BI desktop client and web app
- Connecting to a data source using either the Power BI desktop client or the web app
- Modeling data
- Creating reports and visualizations
This course is designed for professionals who connect to local or cloud-based data sources and then shape and combine data for analysis. They want to analyze business data, visualize insights, and share those insights with peers across the enterprise.
This course is designed for professionals pursuing the Microsoft Power BI Data Analyst (Exam PL-300) certification.
Subjects Covered
- Introduction to Power BI
- What is Power BI?
- Understanding the Power BI Ecosystem (Desktop, Service, Mobile, Embedded)
- Power BI Desktop vs. Power BI Service vs. Excel
- The Role of Semantic Models
- Installing Power BI Desktop
- Exploring the New File Interface
- Adjusting Power BI Settings
- Saving, Opening, and Managing Files
- Building a Simple Report (Quick Demo)
- Connecting and Shaping Data
- What is ETL (Extract, Transform, Load)?
- Understanding Connectivity Types (Import, DirectQuery, Composite)
- Connecting to an Excel Workbook
- Connecting to SQL Server (DirectQuery Example)
- Connecting to Web Data
- Connecting to SharePoint Lists
- Using the Navigator Window
- Refreshing and Managing Data Sources
- Understanding Import Results
- Choosing the Best Connectivity Method
- Creating and Using Parameters in Queries
- Transforming Data with Power Query
- Introduction to Power Query Editor
- Navigating the Power Query Interface
- Shaping and Cleaning Data
- Basic Transformations (Remove Columns, Rename, Filter)
- Changing Data Types
- Resolving Inconsistencies and Nulls
- Removing Duplicates
- Using Data Profiling Tools
- Text, Number, and Date-Time Transformations
- Creating Date Tables and Rolling Calendars
- Index Columns and Conditional Columns
- Creating Columns from Examples
- Grouping and Aggregating Data
- Transpose, Pivot, and Unpivot
- Merging and Appending Queries
- Appending Files from a Folder
- Organizing Queries with Groups
- Viewing Query Dependencies
- Creating a Data Model
- What is a Data Model?
- Star Schema vs. Snowflake Schema
- Fact Tables and Dimension Tables
- Exploring the Model View
- Understanding Primary and Foreign Keys
- Creating and Managing Relationships
- Active vs. Inactive Relationships
- Cardinality and Cross-Filtering
- Relational Models vs. Merged Queries
- Using Bi-Directional Filters
- Managing Table and Field Properties
- Adjusting Data Types, Formats, and Categories
- Creating Hierarchies
- Hiding Fields and Tables from Report View
- Best Practices for Data Modeling
- Writing DAX (Data Analysis Expressions)
- What is DAX and When to Use It?
- Understanding the Difference Between M and DAX
- Calculated Columns vs. Measures
- Implicit vs. Explicit Measures
- DAX Syntax and Operators
- Using Variables in DAX
- Understanding Row Context vs. Filter Context
- Creating a Measures Table
- Common Function Categories:
- Mathematical and Statistical
- Counting Functions
- Logical Functions (IF, SWITCH)
- Text Functions
- Date & Time Functions
- Filter Functions (CALCULATE, FILTER, ALL)
- Time Intelligence Functions
- RELATED and RELATEDTABLE
- Iterator Functions (SUMX, AVERAGEX)
- Debugging DAX with Performance Analyzer
- DAX Pitfalls and Best Practices
- Visualizing Data in Power BI
- Core Visualizations
- Understanding the Report View
- Matching Visuals to Audience Needs
- Creating and Managing Visuals
- Table and Matrix
- Bar, Line, and Area Charts
- Pie and Donut Charts
- Cards, KPIs, and Gauges
- Sorting Visuals and Value Calculations
- Formatting Options and Visual Styles
- Using Titles, Labels, Tooltips, and Focus Mode
- Changing and Removing Visual Types
- Aligning and Organizing Visuals
- Advanced Visuals and UX Features
- Slicers (List, Dropdown, Hierarchical)
- Maps (Filled, Shape, ArcGIS)
- Drill Down, Drill Up, and Drill Through
- Conditional Formatting Techniques
- Bookmarks and Buttons
- Tooltip Pages and Custom Tooltips
- Selection Pane and Layering
- Spotlight and Zoom
- Decomposition Tree and Smart Narrative
- Using Parameters in Visuals
- Creating a Mobile-Friendly Layout
- Filtering and Interaction
- The Filter Pane (Visual, Page, Report Level)
- Clearing and Managing Filters
- Editing Interactions Between Visuals
- Core Visualizations
- Sharing, Publishing, and Refreshing
- Differences Between Power BI Desktop and Power BI Service
- Publishing a Report to the Power BI Service
- Creating and Managing Workspaces
- Creating Dashboards in the Service
- Sharing Reports and Dashboards Securely
- Scheduling Data Refresh in the Cloud
- Setting Row-Level Security (Intro Only)
- Exporting Data and Reports
- Embedding Reports in Other Applications
- Power BI Integration with Excel (Analyze in Excel)
Prerequisites
Before Taking this Class
Intermediate knowledge of Microsoft Excel and basic knowledge of Windows and web browsers.Setup Requirements
Software/Setup For this Class
Power BI Desktop
Onsite Training
Do you have five (5) or more people needing this class and want us to deliver it at your location?

